Thứ Ba, 29 tháng 12, 2015

Oxford Advanced Learner's dictionary for Android


Copy thư mục này vào bộ nhớ trong hoặc thẻ nhớ của điện thoại Android đều được (để ở gốc của thẻ nhớ) Ví dụ nếu copy vào thẻ nhớ như trường hợp của Galaxy Y thì sẽ đường dẫn sẽ là /sdcard/Oxford chứa các file như hình dưới:
data oxford
- Copy file (OALD8.apk) vào bất kỳ thư mục nào trên bộ nhớ. Vào điện thoại, chạy file này để cài đặt và bạn đã có thể sử dụng từ điển này.
Chú ý: Khi bạn sử dụng từ điển này, hãy tắt mạng Wifi/3G đi hoặc nếu Điện thoại của bạn đang sử dụng ROM cook (khác ROM gốc ban đầu của máy) thì để không phải tắt, bạn chỉ cần sử dụng một ứng dụng tường lửa như Droid Wall có trên google play để chặn kết nối internet của từ điển này trong blacklist vì nếu có kết nối mạng thì khi tra từ, từ điển sẽ kiểm tra bản quyền và bạn sẽ nhận đc thông báo như hình dưới. Nếu nhận được thông báo này thì chỉ việc thoát ra, tắt Wifi/3G đi và vào lại sẽ dùng được bình thường.

DucDA update: cài thử mấy firewall nhưng ăn thua. Tốt nhất khi sử dụng từ điển thì tắt Wifi & 3G đi, nếu bị  check bản quyền thì xóa đi cài lại :(

Chủ Nhật, 27 tháng 12, 2015

Hotjar - User's activity tracking

All-in-one Analysis and Feedback... at a fraction of the price.
Hotjar is a new powerful tool that reveals the online behaviour and voice of your users. By combining both A) Analysis and B) Feedback tools, Hotjar gives you the ‘big picture’ of how to improve your site's user experience and performance (conversion rates).
The Analysis tools allow you to measure and observe user behaviour (what users do) while the Feedback tools allow you to hear what your users have to say (Voice of User / Customer).

Analysis Tools


Heatmaps
Understand what users want, care about and do on your site by visually representing their clicks, taps and scrolling behavior - which are the strongest indicators of visitor motivation and desire.
Visitor Recordings
Eliminate guesswork with recordings of real visitor behaviour on your site. By seeing your visitor's clicks, taps, mouse movements you can identify usability issues on the fly.Visitor Recordings
Conversion Funnels
Find the biggest opportunities for improvement and testing by identifying on which page and at which step most visitors are leaving your site.
Form Analytics
Improve online form completion rates by discovering which fields take too long to fill, which are left blank, and why your visitors abandon your form and page.Form Analytics

Feedback Tools


Feedback Polls
Improving the performance and experience of your website starts with understanding what your visitors want and what's preventing them from achieving it. Target questions to specific visitors anywhere on your web and mobile site.
Surveys
Build your own responsive surveys using an easy editor. Collect responses in real-time from any device. Distribute your surveys using web links, emails or invite your visitors just before they abandon your site to uncover their objections or concerns.
Recruit User Testers
Recruit the best possible participants for user research and testing directly from your site. Collect profiling information, contact details and offer a gift in exchange for their help.


Source: http://docs.hotjar.com


Thứ Hai, 30 tháng 11, 2015

ldconfig ld.so.cache

ldconfig has two interesting options:
-f conf
      Use conf instead of /etc/ld.so.conf.
-C cache
      Use cache instead of /etc/ld.so.cache.
I tried copying /etc/ld.so.conf to my own home directory, and edited it to include paths to my local libraries e.g. /home/syockit/local/usr/lib etc. And ran
ldconfig -f /home/syockit/ld.so.conf -C /home/syockit/ld.so.cache
and subsequently, to confirm that the libraries are cached, I ran
ldconfig -f /home/syockit/ld.so.conf -C /home/syockit/ld.so.cache -p | less
and it does include all my libraries on top of also including system libraries.
Now, I want to have the default linker use these two. But in man ld.so, I see no mention of being able to use custom .conf or .cache. So what's the point of the above two options of ldconfig then?

Thứ Hai, 16 tháng 11, 2015

Github how to

Flow: https://guides.github.com/introduction/flow/

Git Ignore configuration: https://github.com/github/gitignore

Thứ Ba, 27 tháng 10, 2015

Shell In A Box – A Web-Based SSH Terminal to Access Remote Linux Servers

Shell In A Box (pronounced as shellinabox) is a web based terminal emulator created by Markus Gutschke. It has built-in web server that runs as a web-based SSH client on a specified port and prompt you a web terminal emulator to access and control your Linux Server SSH Shell remotely using any AJAX/JavaScript and CSSenabled browsers without the need of any additional browser plugins such as FireSSH.
In this tutorial, I describe how to install Shellinabox and access remote SSH terminal using a modern web browser on any machine. Web-based SSH is very useful when you are protected with firewall and only HTTP(s) traffic can get through.

Installing Shellinabox on Linux

By default, Shellinabox tool is included on many Linux distributions through default repositories, includingDebianUbuntu and Linux Mint.
Make sure that your repository enabled and available to install Shellinabox from the that repository. To check, do a search for Shellinabox with the “apt-cache” command and then install it using “apt-get” command. `
On Debian, Ubuntu and Linux Mint
$ sudo apt-cache search shellinabox
$ sudo apt-get install openssl shellinabox
On RHEL, CentOS and Fedora
On Red Hat based distributions, you need to first have enable EPEL repository and then install it using the following “yum” command. (Fedora users don’t need to enable EPEL, it’s already a part of Fedora project).
# yum install openssl shellinabox

Configuring Shellinabox

By default, shellinaboxd listens on TCP port 4200 on localhost. For security reason, I change this default port to a random (i.e. 6175) to make it difficult for anyone to reach your SSH box. Also, during installation a new self-signed SSL certificate automatically created under “/var/lib/shellinabox” to use HTTPS protocol.
On Debian, Ubuntu and Linux Mint
$ sudo vi /etc/default/shellinabox
# TCP port that shellinboxd's webserver listens on
SHELLINABOX_PORT=6175

# specify the IP address of a destination SSH server
SHELLINABOX_ARGS="--o-beep -s /:SSH:172.16.25.125"

# if you want to restrict access to shellinaboxd from localhost only
SHELLINABOX_ARGS="--o-beep -s /:SSH:172.16.25.125 --localhost-only"
On RHEL, CentOS and Fedora
# vi /etc/sysconfig/shellinaboxd
# TCP port that shellinboxd's webserver listens on
PORT=6175

# specify the IP address of a destination SSH server
OPTS="-s /:SSH:172.16.25.125"

# if you want to restrict access to shellinaboxd from localhost only
OPTS="-s /:SSH:172.16.25.125 --localhost-only"

Starting Shellinabox

Once you’ve done with the configuration, you can start the service by issuing following command.
On Debian, Ubuntu and Linux Mint
$ sudo service shellinaboxd start
On RHEL and CentOS
# service shellinaboxd start
On Fedora
# systemctl enable shellinaboxd.service
# systemctl start shellinaboxd.service

Verify Shellinabox

Now let’s verify whether Shellinabox is running on port 6175 using “netstat” command.
$ sudo netstat -nap | grep shellinabox
or
# netstat -nap | grep shellinabox
tcp        0      0 0.0.0.0:6175            0.0.0.0:*               LISTEN      12274/shellinaboxd
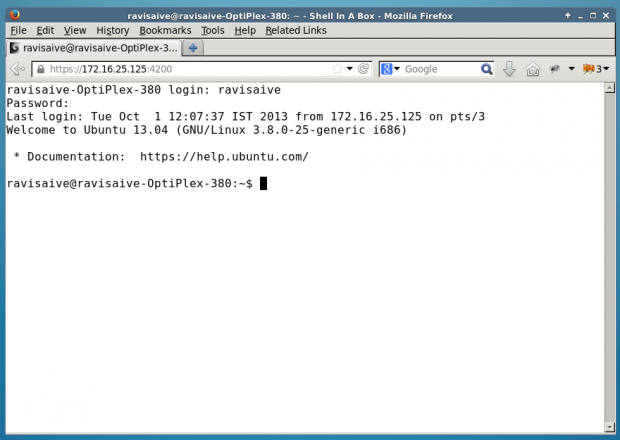
Now open up your web browser, and navigate to https://Your-IP-Adress:6175. You should be able to see a web-based SSH terminal. Login using your username and password and you should be presented with your shell prompt.
Install Shellinabox in Linux
Shellinabox SSH Login
Shellinabox SSH Shell
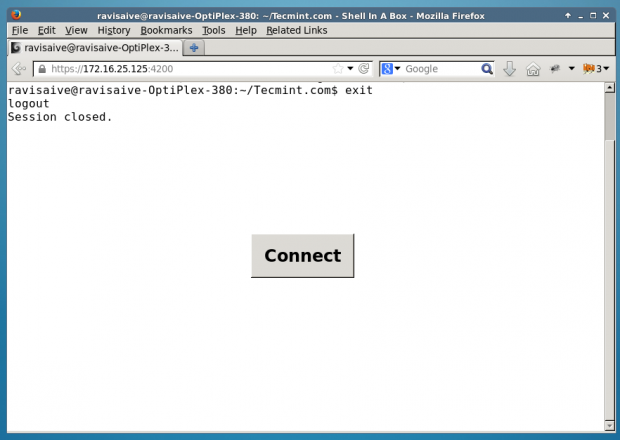
Shellinabox SSH Logout
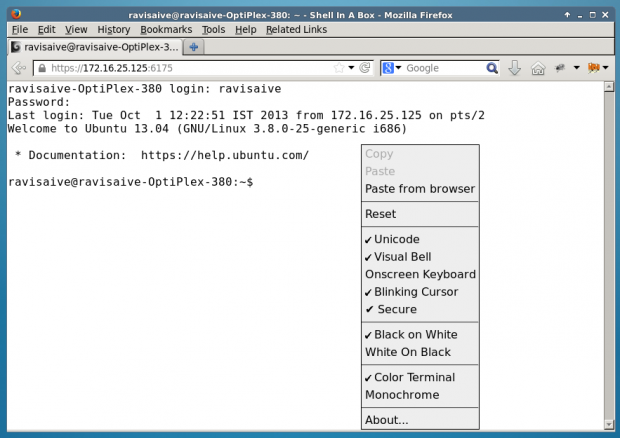
You can right-click to use several features and actions, including changing the look and feel of your shell.
Shellinabox More Options
Make sure you secure you shellinabox on firewall and open 6175 port for specific IP Address to access your Linux shell remotely.
Source: http://www.tecmint.com/shell-in-a-box-a-web-based-ssh-terminal-to-access-remote-linux-servers/

Thứ Bảy, 24 tháng 10, 2015

Các vấn đề đang quan tâm

- Recommender system
- CQRS: http://www.slideshare.net/HanoiItlc/itlc-hanoi-cqrs-es-2210-2015?from_m_app=android
- X-XSS-Protection firewall

Thứ Hai, 19 tháng 10, 2015

Following up network connections with conntrack

Linux has got the ability to perform a monitoring of existing connections by means of the conntrack module, which is compiled but not installed in distributions such as RHEL or CentOS. In order to load it, you can run the next order.

[root@centos ~]# modprobe ip_conntrack

In other operating systems like Debian or Ubuntu Server, first of all you must install the conntrack package and load thenf_conntrack_ipv4 module (if you want to work with IPv6, you will have to load the nf_conntrack_ipv6 module).

root@ubuntu-server:~# aptitude install conntrack

root@ubuntu-server:~# modprobe nf_conntrack_ipv4

The conntrack module allows the kernel to register in a table all network connections of the system (established, time_wait, close, etc.). It used by several applications such as iptstate (it shows information about the state of the system connections) or Shorewall (firewall).

Another example of use for this module it is for instance, when the server has to realize NAT tasks with iptables and it is necessary to keep a table of connections implicated.

The file where conntrack logs all connections is /proc/net/ip_conntrack.

root@ubuntu-server:~# cat /proc/net/ip_conntrack
tcp      6 89 TIME_WAIT src=192.168.1.11 dst=192.168.1.12 sport=59302 dport=10050 packets=5 bytes=291 src=192.168.1.12 dst=192.168.1.11 sport=10050 dport=59302 packets=5 bytes=289 [ASSURED] mark=0 secmark=0 use=1
...

root@ubuntu-server:~# conntrack -L
tcp      6 89 TIME_WAIT src=192.168.1.11 dst=192.168.1.12 sport=59302 dport=10050 packets=5 bytes=291 src=192.168.1.12 dst=192.168.1.11 sport=10050 dport=59302 packets=5 bytes=289 [ASSURED] mark=0 secmark=0 use=1
...

The two first fields are the connection protocol (TCP, 6) and then is the connection state (TIME_WAIT). The rest of the fields represent the IP addresses and ports involved, as well as the number of packets and bytes exchanged between the two points of the connection.

You have also to take into account that Linux saves the connection state in memory, and each of them uses around 350 bytes.

If you want to know how many open connections has got the system, you can utilize the following sentences.

root@ubuntu-server:~# cat /proc/net/ip_conntrack | wc -l
856

root@ubuntu-server:~# cat /proc/sys/net/ipv4/netfilter/ip_conntrack_count
856

root@ubuntu-server:~# conntrack -C
856

This value is quite important because if at any moment we appreciate that any of our services works slowly (for instance Apache) or many connections are rejected, it can be due to which the number of open connections exceeds the maximum number of connections allowed.

root@ubuntu-server:~# cat /proc/sys/net/ipv4/netfilter/ip_conntrack_max
65536

The size of the hash table is also limited.

root@ubuntu-server:~# cat /proc/sys/net/ipv4/netfilter/ip_conntrack_buckets
16384

If you want to modify it, you must do it when the module is loaded.

root@ubuntu-server:~# modprobe nf_conntrack_ipv4 hashsize=32768


Other important parameters which can be changed to optimize the system are related to the time of the different types of connections.

root@ubuntu-server:~# cat /proc/sys/net/ipv4/netfilter/ip_conntrack_tcp_timeout_established
432000

root@ubuntu-server:~# cat /proc/sys/net/ipv4/netfilter/ip_conntrack_tcp_timeout_time_wait
120

root@ubuntu-server:~# cat /proc/sys/net/ipv4/netfilter/ip_conntrack_tcp_timeout_close_wait
60

The first parameter sets up the maximum lifetime for an already established connection (432000 sg can be long; 28800 could be enough). The second and third are the maximum lifetime for a waiting connection and for the remote endpoint closes the socket.

So as to list all variables based on the conntrack module, type the next order.

root@ubuntu-server:~# sysctl -a | grep conntrack | grep ipv4
net.ipv4.netfilter.ip_conntrack_generic_timeout = 600
net.ipv4.netfilter.ip_conntrack_tcp_timeout_syn_sent = 120
net.ipv4.netfilter.ip_conntrack_tcp_timeout_syn_sent2 = 120
net.ipv4.netfilter.ip_conntrack_tcp_timeout_syn_recv = 60
net.ipv4.netfilter.ip_conntrack_tcp_timeout_established = 432000
net.ipv4.netfilter.ip_conntrack_tcp_timeout_fin_wait = 120
net.ipv4.netfilter.ip_conntrack_tcp_timeout_close_wait = 60
net.ipv4.netfilter.ip_conntrack_tcp_timeout_last_ack = 30
net.ipv4.netfilter.ip_conntrack_tcp_timeout_time_wait = 120
net.ipv4.netfilter.ip_conntrack_tcp_timeout_close = 10
net.ipv4.netfilter.ip_conntrack_tcp_timeout_max_retrans = 300
net.ipv4.netfilter.ip_conntrack_tcp_loose = 1
net.ipv4.netfilter.ip_conntrack_tcp_be_liberal = 0
net.ipv4.netfilter.ip_conntrack_tcp_max_retrans = 3
net.ipv4.netfilter.ip_conntrack_udp_timeout = 30
net.ipv4.netfilter.ip_conntrack_udp_timeout_stream = 180
net.ipv4.netfilter.ip_conntrack_icmp_timeout = 30
net.ipv4.netfilter.ip_conntrack_max = 15768
net.ipv4.netfilter.ip_conntrack_count = 2
net.ipv4.netfilter.ip_conntrack_buckets = 4096
net.ipv4.netfilter.ip_conntrack_checksum = 1
net.ipv4.netfilter.ip_conntrack_log_invalid = 0

And if you want to change the value of any variable, you must add it within the sysctl.conf file and reload the settings.

root@ubuntu-server:~# cat /etc/sysctl.conf
...
net.ipv4.netfilter.ip_conntrack_max = 131072

root@ubuntu-server:~# sysctl -p

One interesting option for the conntrack command is the possibility to get the statistics about the connection tracking.

root@ubuntu-server:~# conntrack -S
entries                 2  
searched                0  
found                   1107
new                     4  
invalid                 0  
ignore                  0  
delete                  2  
delete_list             2  
insert                  4  
insert_failed           0  
drop                    0  
early_drop              0  
icmp_error              0  
expect_new              0  
expect_create           0  
expect_delete           0  
search_restart          0

Another useful feature for conntrack is to output the connection state on real-time, similar to when you run a "tail -f" on a file.

root@ubuntu-server:~# conntrack -E

We can conclude with this couple of articles that the conntrack module is other helpful way to improve the Linux performance.


Source: http://redes-privadas-virtuales.blogspot.com/2011/02/following-up-network-connections-with_27.html

Chủ Nhật, 18 tháng 10, 2015

Mysqldump ignore some tables

mysqldump -u username -p database --ignore-table=database.table1 > database.sql
If you want to ignore multiple tables you can use a simple script like this
#!/bin/bash
PASSWORD=XXXXXX
HOST=XXXXXX
USER=XXXXXX
DATABASE=databasename
DB_FILE=dump.sql
EXCLUDED_TABLES=(
table1
table2
table3
table4
tableN   
)

IGNORED_TABLES_STRING=''
for TABLE in "${EXCLUDED_TABLES[@]}"
do :
   IGNORED_TABLES_STRING+=" --ignore-table=${DATABASE}.${TABLE}"
done

echo "Dump structure"
mysqldump --host=${HOST} --user=${USER} --password=${PASSWORD} --single-transaction --no-data ${DATABASE} > ${DB_FILE}

echo "Dump content"
mysqldump --host=${HOST} --user=${USER} --password=${PASSWORD} ${DATABASE} ${IGNORED_TABLES_STRING} >> ${DB_FILE}
Source: http://stackoverflow.com/questions/425158/skip-certain-tables-with-mysqldump

Thứ Sáu, 4 tháng 9, 2015

Linux Iptables ip_conntrack: table full, dropping packet error and solution


y Red hat Enterprise Linux 5 server reporting the following message in /var/log/messages (syslog):
ip_conntrack: table full, dropping packet.
How do I fix this error?
A. If you notice the above message in syslog, it looks like the conntrack database doesn't have enough entries for your environment. Connection tracking by default handles up to a certain number of simultaneous connections. This number is dependent on you system's maximum memory size.
You can easily increase the number of maximal tracked connections, but be aware that each tracked connection eats about 350 bytes of non-swappable kernel memory!
To print current limit type:
# sysctl net.ipv4.netfilter.ip_conntrack_max
Output:
8192
To increase this limit to e.g. 12000, type:
# sysctl -w net.ipv4.netfilter.ip_conntrack_max=12000
Alternatively, add the following line to /etc/sysctl.conf file:
net.ipv4.netfilter.ip_conntrack_max=12000
The following will tell you how many sessions are open right now:
# wc -l /proc/net/ip_conntrack
Output:
5000 /proc/net/ip_conntrack

Thứ Tư, 26 tháng 8, 2015

MySQL proceduce

BEGIN
  DECLARE cursor_ID INT;
  DECLARE tmp VARCHAR (20) DEFAULT "";
  DECLARE cursor_VAL VARCHAR (20) DEFAULT "";
  DECLARE done INT DEFAULT 0;
  DECLARE cursor_i CURSOR FOR SELECT id, sub_key FROM tmp_mtv_sub_vod6 ORDER BY sub_key ASC, status DESC, price ASC;
  DECLARE CONTINUE HANDLER FOR NOT FOUND SET done = TRUE;
  OPEN cursor_i;
  read_loop: LOOP
    FETCH cursor_i INTO cursor_ID, cursor_VAL;
    IF done THEN
      LEAVE read_loop;
    END IF;
    if tmp  = cursor_VAL THEN
      delete from mtv_sub_vod where id = cursor_ID;
      END IF;
    SET tmp = cursor_VAL;
  END LOOP;
  CLOSE cursor_i;
END

Thứ Tư, 12 tháng 8, 2015

Zero-Downtime Restarts with HAProxy


Putting up a maintenance page while you are doing an update and restarting your application servers is good practice, but it definitely hurts the user experience. This, in turn, translates to less frequent releases and frustration for both the developer and the users (release often, release early!). To address this, the Rails community has come up with a couple of approaches to mitigate the problem: Seesaw, one-at-a-time restarts, and Swiftiply, none of which, unfortunately, caught on with the crowd. Well, it turns out, HAProxy has a beautiful solution for this problem!

Existing Solutions

The challenge with doing a rolling restart is in the coordination between your application servers, and an upstream reverse-balancer (HAProxy, Nginx, Apache, etc.). In theory, if you have a cluster of servers, you could cycle them one after another, as Carl has suggested, but that means that the upstream balancer is unaware of the maintenance window, and hence it may dispatch a request to a bad server - resulting in either a dropped request, or a hiccup in response time.
Swiftiply offers a much cleaner solution to this problem: each application server connects to the proxy itself, and thus the cluster can be dynamically modified at runtime. Great idea, but there is the unfortunate Ruby dependency - what if we're running a non Ruby service?

Seamless Restarts With HAProxy
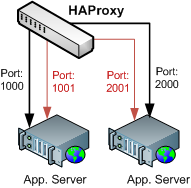
HAProxy architecture document shows that we can specify a backup for every application server in our cluster. Thus, if you're running a mission critical application, you could specify a hot standby which is ready to take over the traffic. Nice feature, but we're going to use it for a slightly different purpose.
Instead of specifying a physically different app server, we're going to define our backup instance to be the exact same application server in each case, but with one minor difference: the status port, for the main app server will be different from the one we use on the backup.
backend srvs
  # webA and webB are monitored on different ports from backup servers
  # but bkpA, webA and bkpB and webB are actually the same server!

  server webA 127.0.0.1:1000 check port 2000 inter 2000
  server webB 127.0.0.1:1001 check port 2001 inter 2000

  server bkpA 127.0.0.1:1000 cookie A check port 1000 inter 2000 backup
  server bkpB 127.0.0.1:1001 cookie B check port 1001 inter 2000 backup

Using IPTables to Notify HAProxy

Let's take webA as an example: the backup server listens on port 1000, and status port for backup is set to 1000 (HAProxy pings the server on that port every two seconds to see if its up), but the 'main' instance will have a different status port, which we will forward with IPTables:
# forward port 2000 to 1000
$ iptables -t nat -A OUTPUT -p tcp --dport 2000 -j REDIRECT --to-port 1000
$ iptables -t nat -A PREROUTING -p tcp --dport 2000 -j REDIRECT --to-port 1000

# remove port forwarding from 2000 to 1000
$ iptables -t nat -D OUTPUT -p tcp --dport 2000 -j REDIRECT --to-port 1000
$ iptables -t nat -D PREROUTING -p tcp --dport 2000 -j REDIRECT --to-port 1000
rolling-restart.zip - Test setup, and configuration files

Migrating Server In/Out of Maintenance

Now, if we want to put the server into maintenance mode, we remove the IPTables rule for the forwarded port, and wait a few seconds so that our upstream HAProxy instance recognizes that the server is no longer available for new connections - this is key, it means that no client is dropped in the process. Now, once the server is out of rotation in HAProxy, we can do a graceful restart, add the IPTables rule back in, and we're live! Hence, the full restart sequence is:
  • Delete IPTables rule for the status port
  • Wait for HAProxy to take server out of rotation for new clients
  • Perform graceful restart of the application server
  • Add IPTables rule for the status port
As an added bonus, you can even make this work with sticky sessions by adding a server ID into a cookie (see example HAProxy config in the zip). The clients won't notice a thing, and the developers can do zero-downtime releases!


Source: https://www.igvita.com/2008/12/02/zero-downtime-restarts-with-haproxy/

Thứ Bảy, 8 tháng 8, 2015

PROCESS STATE CODES

PROCESS STATE CODES Here are the different values that the s, stat and state output specifiers (header "STAT" or "S") will display to describe the state of a process: D uninterruptible sleep (usually IO) R running or runnable (on run queue) S interruptible sleep (waiting for an event to complete) T stopped, either by a job control signal or because it is being traced. W paging (not valid since the 2.6.xx kernel) X dead (should never be seen) Z defunct ("zombie") process, terminated but not reaped by its parent. For BSD formats and when the stat keyword is used, additional characters may be displayed: < high-priority (not nice to other users) N low-priority (nice to other users) L has pages locked into memory (for real-time and custom IO) s is a session leader l is multi-threaded (using CLONE_THREAD, like NPTL pthreads do) + is in the foreground process group.
Source: http://askubuntu.com/questions/360252/what-do-the-stat-column-values-in-ps-mean